
Study design
This study is a randomized controlled trial, single-blind, repeated measures of parallel groups (elastic bands group: EBG; and group-based dance: GBD), and a quantitative methodology. The randomization was made using the randomizer internet site (https://www.randomizer.org). The methodology followed was the Consolidated Standards of Reporting Trials Statement (CONSORT) guidelines [26]. In addition, it has been registered in the Clinical Trial Protocol Registry and Results System (ClinicalTrials.gov) of the United States of America (code: NCT05275140; https://clinicaltrials.gov/search?cond=NCT05275140, first posted on March 11, 2022). The interventions occurred for 12 weeks, with three sessions a week (on Mondays, Wednesdays, and Fridays) of 60 min each. The evaluations were body composition (% to fat mass and fat-free mass), HGS in the dominant hand (kg) and non-dominant hand (kg), leg strength (kg), TUG (s), and walking speed (s). All assessments were conducted in the morning (between 9:00 to 11:30 h) and in the exact location (Laboratory, with the control of variables, temperature, and investigators that applied the devices in pre- and post-assessments). The older women did not present pain before the assessments or during the training sessions, without presenting musculoskeletal and/or cardiorespiratory injuries during the intervention.
Participants
Forty-four older women initially participated in the intervention. The sample size calculation indicates the ideal number of participants per group (n = 12 older women). According to a prior study [21], for this calculation, an average difference of 0.55 s in the TUG test was used as the minimum difference required for substantial clinical relevance, with a standard deviation of 0.37 s, considering an alpha level of 0.05 with 95% power and an expected loss of 20%. GPower software (Version 3.1.9.6, Franz Faul, Universiät Kiel, Kiel, Germany) was used to calculate statistical power.
The inclusion criteria were: (i) older women aged between 60 and 90 years old; (ii) healthy by self-report (i.e., completion of the revised physical activity readiness questionnaire for older people); (iii) functionally independent, that is, have a score equal to or greater than 43 points in the Preventive Medicine Exam for the Older People (in Spanish, EMPAM) of the Ministry of Health of Chile [27]; (iv) older women with sarcopenia, which was identified to have two of the following three criteria: low muscle strength, low muscle quantity or quality, and low physical performance; according to the criteria of the established by Cruz-Jentoft [28], i.e., low muscle strength (HGS < 16 kg; chair stand test > 15 s for five rises), low muscle quantity or quality (appendicular skeletal muscle mass < 15 kg), and low physical performance (gait speed ≤ 0.8 m/s; and short physical performance battery ≤ 8 point score). The exclusion criteria following: (i) participants who presented any cardiovascular or respiratory pathology or musculoskeletal injury that prevented them from practicing physical activity; (ii) those who are permanently or temporarily unable to engage in physical activity; and (iii) those who presented moderate or severe cognitive impairment (≥ 15) assessed by the abbreviated Mini-Mental State Examination [29].
All participants had to accept the criteria for using and handling the data by signing an informed consent form authorizing the use of the information for scientific purposes. The research protocol was approved by the Research of Universidad Católica del Maule, Chile (approval number: N°29-2022) and developed following the Declaration of Helsinki with human beings.
Primary outcomes
Body composition
Tetrapolar bioimpedance was used with eight tactile point electrodes on the InBody 570®, a body composition analyzer from Seoul, Korea, to determine the percentages of fat mass and fat-free mass. Every measurement was carried out in accordance with the International Society for Advances in Kinanthropometry (ISAK) guidelines [30].
Handgrip strength (HGS)
A portable dynamometer, manufactured by Patterson Medical, Sammons Preston Rolyan, Chicago, Illinois, USA, was used. The test was performed in a seated position, with the spine aligned, the shoulder in neutral position, the elbow flexed at 90 degrees to the side of the body, the forearm in neutral position and the wrist in neutral position, allowing the above suggestions [31]. According to the size of the hand, the position of the dynamometer was chosen to allow a secure grip of the instrument while maintaining adequate closure of the metacarpal phalangeal and interphalangeal joints, favoring contact between the first phalanx of the index finger and the thumb. Each person performed three rounds for each hand, with a 120-second rest between rounds.
Leg strength
A 5-minute overall warm-up was completed, followed by dynamic stretching for the lower limbs at low to moderate intensity (2 to 3 points in a rating of perceived exertion-RPE), followed by 90° leg flexions and extensions at a moderate intensity which was measured using the ten-point RPE [32]. The older women then sat on a leg press machine with the test load securely positioned in the starting position at moderate intensity (3 points of RPE). Following a previous study [33], the participants rated their feet on the leg press platform with their heels shoulder-width apart and below their knees. They were instructed to lift the weight off the rack, release the safety catch and prepare for the downward phase of the movement. The participant lowered the load to his buttocks until his knees were just below 90 degrees before concentrically contracting the leg muscles and extending the load back up, performing ten submaximal repetitions, after which he placed the weight securely on the rack before stepping off the machine. We continued with the same procedure but moved to a moderate-to-vigorous intensity load (3 to 5 points of RPE), executing five submaximal repetitions. In the end, we gave a rest of 2 to 3 min. We continued with a vigorous to very vigorous intensity load (7 to 9 points of RPE), performing two submaximal repetitions at the end, of which a rest of 3 to 5 min was granted. Finally, a repetition was performed with a maximum intensity load (10 points of RPE) which was recorded for statistical analysis.
Timed up-and-go (TUG)
This test involved rising from a chair with an armrest that was 50 cm from the ground, walking three meters, turning, and then returning to the starting position. The test was conducted in accordance with advice from Podsiadol and Richardson [34]. On a wooden indoor track, participants completed three trials with three minutes of rest in between. The best result was picked for statistical analysis after the time was estimated to within 0.01 s using single-beam infrared photoelectric cells (Brower Timing System, Salt Lake City, UT, USA).
Walking speed
The participants were told to walk for four meters twice with their all-out effort as quickly as they could without sprinting. Single-beam infrared photoelectric cells (Brower Timing System, Salt Lake City, UT, USA) were used to measure the time to the nearest 0.01 s. Starting from a standing position, each participant put their favorite foot forward and slightly back of the starting line. When participants voluntarily started the trial, which triggered timing, the test began. The timing gates were placed at the start of the race (0.3 m in front of the starting line) and at 4 m, about 0.7 m above the ground (i.e., hip level). The system used in this study was designed to accurately record trunk movements while minimizing the probability of spurious stimuli caused by limb movements. During the experimentation, participants concluded multiple trials with a 3-min rest period between each attempt. All tests were performed on an indoor wooden track. For data analysis, the best outcome from each participant was selected, agreeing with a previous research [35].
Secondary outcomes
Anthropometric parameters
Bipedal height (cm) was measured with a stadiometer (Seca model 220, SECA, Hamburg, Germany; accuracy to 0.1 cm) and body mass (kg) was determined by donning the bare minimum of clothing and using a mechanical scale (Scale-tronix, Chicago, IL, USA; accuracy to 0.1 kg). Every measurement was carried out in accordance with the ISAK guidelines [30].
Sociodemographic assessments
Age (years), academic level (primary, secondary, bachelor, master, Ph.D.), and civil status (married, separated, widowed, single, others).
Interventions
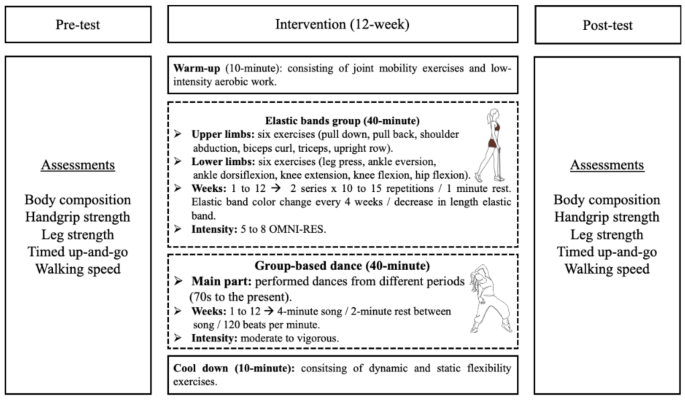
The participants’ vital signs were measured using an automated pressure monitor (08 A, CONTEC, Alsdorf, Germany) to determine their systolic and diastolic blood pressure as well as their resting heart rate prior to each session of elastic band training and group-based dance. The elastic bands training and group-based dance had a general structure that started with a 10-minute warm-up that included joint mobility exercises and a low-intensity aerobic program; after that, the central part (elastic bands and group-based dance) was developed for 40 min, and it was designed to end with a 10-minute cool-down that included dynamic and static flexibility exercises. Figure 1 provides a summary of the measures and intervention progression.

Assessments and progression for interventions. Legends: OMNI-RES: OMNI-Resistance Exercise Scale of perceived exertion
Elastic band training is based on previous researches [21, 36] that demonstrated that it is safe and effective for older people. Using the Thera Band® rubber band system (Hygenic Corporation, Akron, Ohio). The colors of the elastic bands (yellow, red, green, blue, black, silver, and gold), each corresponding to a certain range of endurance strength, were used to indicate training loads. The OMNI-Resistance Exercise Scale of perceived exertion was used to control the resistance training intensity, which ranged from moderate to vigorous (5–8 points) [37]. Six upper limbs strength exercises (pulldown, pullback, shoulder abduction, biceps curl, triceps, upright) and 6 for lower limbs (leg press, ankle eversion, ankle dorsiflexion, knee extension, knee flexion, and hip flexion). The older women started with the lowest resistance (yellow color), achieving a 10-repetition maximum (10 RM) of an upper and/or lower limbs exercise, proceeding to the next elastic band color until the 10 RM could not be produced. The final elastic band was the one chosen to begin the training program. During each training session, the older women reacted to two sets at an intensity equivalent to 100% (10 RM) with a 1-minute rest between each exercise. For 12 weeks of intervention, the volume was constant using two sets of 10 to 15 repetitions for each upper and lower limbs exercises. The maximum strength (with 10 RM) was measured with an elastic band of higher resistance. If they could achieve the 10 RM, they proceeded in color every four weeks; if they could not progress to a band of higher resistance, the length of the band was shortened by half. In this way, it remained until 12 weeks of intervention.
The group-based dance consisted of a warm-up using dances from the 1960 and 1970 s at low to moderate intensities (10 min). The central part (40 min) consisted of dances of moderate to high intensity from different periods (the 70s to the present), where each song lasted approximately 4 min with 2-minute rest between each piece. To finish (10 min), cool down through relaxing music and execute dynamic and static flexibility exercises. The intensity remained moderate to vigorous, having a heart rate < 120 beats per minute [19].
Statistical analysis
Firstly, the Shapiro-Wilk test was used to determine the data normality. After the normality confirmation, the values were reported as mean and standard deviation. A two-factor repeated measures of analysis of variance (ANOVA) was used to measure the group×time effect of all variables. When the group×time interaction was significant, the Bonferroni post-hoc test was performed to establish intragroup differences (pre vs. post), while intergroup differences (EBG vs. GBD) were determined with the Mann-Whitney U test. The effect size (ES) was determined through Cohen’s d, considering a small (0.20–0.49), moderate (0.50–0.79), or large (> 0.80) effect [38]. A significant difference was established for all analyses at 5%. Data were analyzed with SPSS 25.0 statistical software (SPSS 25.0 for Windows, SPSS Inc., Chicago, IL, USA).


