
Study design and participants
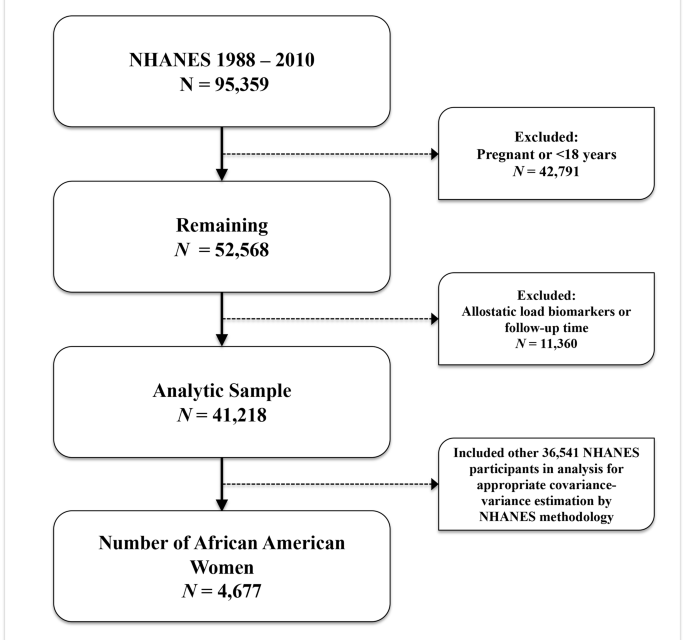
We performed a retrospective cohort analysis using data from the National Health and Nutrition Examination Survey (NHANES), a representative sample of non-institutionalized US residents linked with the National Center for Health Statistics (NCHS) 2019 National Death Index (NDI) file. The NHANES program oversamples those aged 60 and older, Latinx and non-Hispanic (NH)-Black (henceforth, African American or AA) individuals, and weighted analysis generates generalizable estimates [19]. The weighted sample of NHANES is comparative to non-institutionalized United States (U.S.) population [20]. Using NHANES survey data from years 1988 through 2010 linked with NDI data (follow-up data through December 31, 2019) we examined the association between the intersectionality of educational attainment and allostatic load with risk of cancer mortality. The NHANES survey includes information on sociodemographics, clinical measurements, and health-related questionnaires. NHANES participants with data on biomarkers were used in this analysis. We performed analysis among NHANES participants with data on biomarkers and within a fasting subsample (N = 95,359). Patients were excluded if they reported current pregnancy or were less than 18 years of age (N = 42,791), were missing AL biomarkers or not linked via NDI (N = 11,360). This resulted in a final analytic sample of NHANES participants aged 18 and older, corresponding to a total of 41,218 participants over a 22- year study period, of which 4,677 identified as AA women (Fig. 1). We completed analyses using domain statements to account for appropriate estimations of covariance-variance structures using specific strata, cluster, and weighting procedures as specified by NHANES methodology. We created a race/ethnicity-sex specific variable based on the intersectionality of race/ethnicity with sex specified at survey, and thus we had an eight level variable containing: [1] AA men, [2] AA women, [3] NH-White men, [4] NH-White women, [5] Hispanic men, [6] Hispanic women, [7] Other/mixed race men, and [8] Other/mixed race women. We also note that NHANES did not collect granular gender identity terms, and thus we are unable to elucidate whether men/women were cis- or trans- identifying adults. Mortality status or vital status for participants was determined through NHANES-NDI linked file.
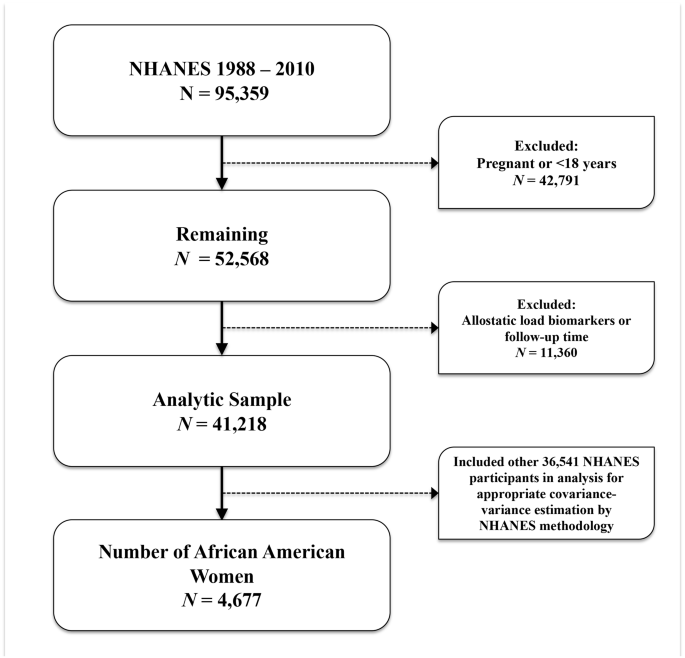
Flowchart of exclusion criteria and final study population of NHANES participants
Ethical statement
The Institutional Review Boards considered this study exempt from review because of the use of secondary, publicly available, and de-identified data.
Educational attainment, effect modifier
This study mirrored methods of our investigative team’s prior work, Williams et al. (2022), to determine our variables of interest [18]. We examined educational attainment as an effect modifier on the relationship between which was determined from the NHANES question “What is the highest grade or level of school you completed or highest degree received?”. We then categorized educational attainment into a four-level variable based on participants’ that completed [1] less than an high school (HS) education; [2] high school graduate, general education development test (GED), or equivalent; [3] some college; and [4] college graduate or above [18]. Due to the NHANES data collection, we could not differentiate by specific degree types (e.g., MD, PhD, MSN). Educational attainment was treated as an effect modifier within our education stratified results examining the association between allostatic load and long-term risk of cancer death.
Allostatic load, primary independent variable
AL has been defined using varying components, although most incorporate biomarker measures from three different categories, including physiologic functioning, which incorporates cardiovascular, metabolic, and immune systems [21]. While there is no consensus definition, we decided to define AL using the Geronimus et al. (2006) and Moore et al. (2021) taxonomies [10, 15]. AL components included body mass index (BMI), diastolic blood pressure (DBP), glycohemoglobin (hemoglobin A1c), systolic blood pressure (SBP), total cholesterol, serum triglycerides, serum albumin, serum creatinine, and C-reactive protein (CRP). We considered sex as a biological variable according to National Institutes of Health guidelines regarding human subjects research [22, 23]. To determine the high-risk thresholds for each AL component, we examined the sex reported at survey-specific distributions of each component among the entire study sample with complete biomarker data. High-risk thresholds were determined by either being above the 75th percentile for BMI, CRP, DBP, glycated hemoglobin, SBP, total cholesterol, serum triglycerides, and serum creatinine [24, 25] or below the 25th percentile for serum albumin. Therefore, each NHANES participant was scored as either 1 (high-risk) or 0 (low-risk) based on sex at baseline survey-specific cutoffs for each component. Total AL score was calculated by summing the individual components, ranging from 0 to 9. Participants were further categorized with AL scores greater or equal to 3 as having high AL [21, 26].
Joint effect of allostatic load and educational attainment
After categorizing NHANES participants based on the distribution of AL components and their self-reported educational attainment, we created a variable examining the intersection of AL and educational attainment. This variable was categorized into eight levels; [1] college graduate or more living with low AL (n = 256), [2] college graduate or more living with high AL (n = 258), [3] some college with low AL (n = 524), [4] some college with high AL (n = 598), [5] HS diploma or equivalent with low AL (n = 662), [6] HS diploma or equivalent with high AL (n = 849), [7] less than HS with low AL (n = 473), and [8] less than HS with high AL (n = 1,044).
Primary outcome of interest, cancer death
Our primary outcome of interest was the time to cancer death. Deaths attributed to malignant neoplasms (ICD-10 019–043) were included as cancer-related deaths. Our primary outcome of interest was time to cancer-related death. Follow-up data for this analysis was available through December 31, 2019, based on NDI-NHANES publicly available linkages. The primary determination of mortality for eligible NHANES participants is based upon matching survey records to the NDI although additional redundant sources are also incorporated, including the Social Security Administration, the Centers for Medicare and Medicaid Services, data collection, NCHS’ follow- up surveys (e.g., NHEFS), and ascertainment of death certificates.
Other variables of interest
We included other variables as covariates based on their consideration as potential confounders, or their possible effect on education, cumulative stress, and cancer outcomes based on prior studies. These variables included NHANES baseline survey completion period (e.g., 1988–1991 through 2009–2010), family poverty-to-income ratio (PIR), current smoking status, any self-reported history of cancer, congestive heart failure, and ever heart attack. PIR was calculated as the ratio of total family income to poverty threshold values by NHANES investigators [18]. Participants that reported no income were given a zero value for PIR [18]. PIR values greater than 1 are above the poverty level, and values near 5 are considered very high income, while PIR values less than 1 are considered below the official poverty line [18]. Participants who had smoked at least 100 cigarettes in their lifetime and who were currently smoking during survey administration were categorized as current smokers [18]. We determined self-reported diagnoses by doctor for cancer, congestive heart failure, or heart attack from NHANES questionnaires on whether “…a doctor or other health professional ever told you that you had … (cancer, angina, congestive heart failure (CHF), or heart attack” [18].
Statistical analysis
Primary analyses were conducted using NHANES-generated sampling statistical strata, clusters, and weights as designated and described in detail within the NHANES methodology handbook [27]. NHANES only measures biomarkers among a random sample of participants each survey period, and in turn creates subsample weights to account for the probability of being selected into the subsample component and additional non-response bias. We combined NHANES weighting variable accounting for the 18-years of cross-sectional data (1988–1994 and 1999–2010). The mobile examination center (MEC) included physical measurements such as blood pressure, a dental examination, and the collection of blood and urine specimens for laboratory testing. Following analytic guidelines by the National Center for Health Statistics (NCHS) [20, 28, 29], we utilized the NHANES MEC sample weights for NHANES III (years 1988–1994) and NHANES 1999–2010 and constructed an adjusted weight by modifying the weights to have a common denominator of 18; that is, [1] the six-year weight for 1988–1994 was multiplied by 1/3, [2] the four-year weight for 1999–2002 was multiplied by 1/4.5, and [3] the two-year cycle weights for each subsequent NHANES survey years 2003–2010 were multiplied by 1/9. There are three methodological assumptions to note when combining these years of data: [1] there are no differences in the estimates over the time periods being combined; [2] regarding the interpretation, the estimates are the average over the period; and [3] NHANES III (1988–1994) recruited US non-institutionalized population aged 2 months and older, while continuous (1999 and later) has recruited all ages.
For descriptive statistics we presented categorical variables as weighted row percentages and continuous variables as mean and associated 95% confidence intervals using appropriate SAS survey weighted procedures including PROC SURVEYFREQ, SURVEYMEANS, and SURVEYREG accordingly [30]. Mean survival times were estimated using the product-limit method of the Kaplan-Meier survival estimator. Proportionality assumption was assessed for our primary variable of interest (education attainment by allostatic load status) by examining the proportion of 1000 simulations that contain a maximum cumulative martingale residual larger than the observed maximum cumulative residuals using the SAS procedure ‘supremum test’. None of our exposure levels had p values that were statistically significant (p value < 0.05), and therefore none of our residuals were larger than expected and we did not reject proportional hazards assumptions. Relative rates of cancer death by groups of educational attainment/allostatic load were estimated by fitting survey-weighted Cox proportional hazards models with time-to-cancer death as the endpoint16. Individuals were censored at the time of their event, death, or end of follow-up (December 31, 2019). Models were sequentially adjusted first for age, then with age, poverty to income ratio, and smoking status.
Multiplicative interactions of AL and educational attainment were examined by introducing an interaction term within our model and presenting the corresponding p-value for this association. P-values ≤ 0.05 were considered statistically significant. Additionally, we conducted all the time-to-cancer death event survival analyses by allostatic load status (high versus low allostatic load), stratified by educational attainment. Estimates were presented from our survey-weighted Cox proportional hazard models as hazard ratios (HRs) and associated 95% confidence intervals (CIs). We conducted two sets of sensitivity analyses. We repeated all survival analyses using un-weighted Cox proportional hazard models and thus treating NHANES participants as a simple random sample. In addition, we examined the relationships between the joint effect of education with allostatic load on cancer death risk, and the moderated effect of education on the relationship between allostatic load and cancer death risk while excluding NHANES participants with a history of cancer. All statistical analyses were performed using SAS (version 9.4, SAS Institute, Inc., Cary, North Carolina, USA).


