
Minnesotans work at higher rates than the nation as a whole. They also are more likely to be in a union and earn more money.
“It’s good to live in Minnesota,” said Aaron Sojourner, a labor economist at the W.E. Upjohn Institute for Employment Research.
Now is especially a good time, as a labor shortage is pushing up wages for low-wage workers and creating opportunities for people with less formal education and other barriers to employment like criminal convictions.
Not everything is rosy. There are wide gaps between sky-high executive compensation and the average worker salary. Housing is gobbling up more of people’s wages, as are rising prices for necessities like food, health care and child care. The state also has persistent racial and gender disparities in income.
Here are five charts on the state of labor in Minnesota.
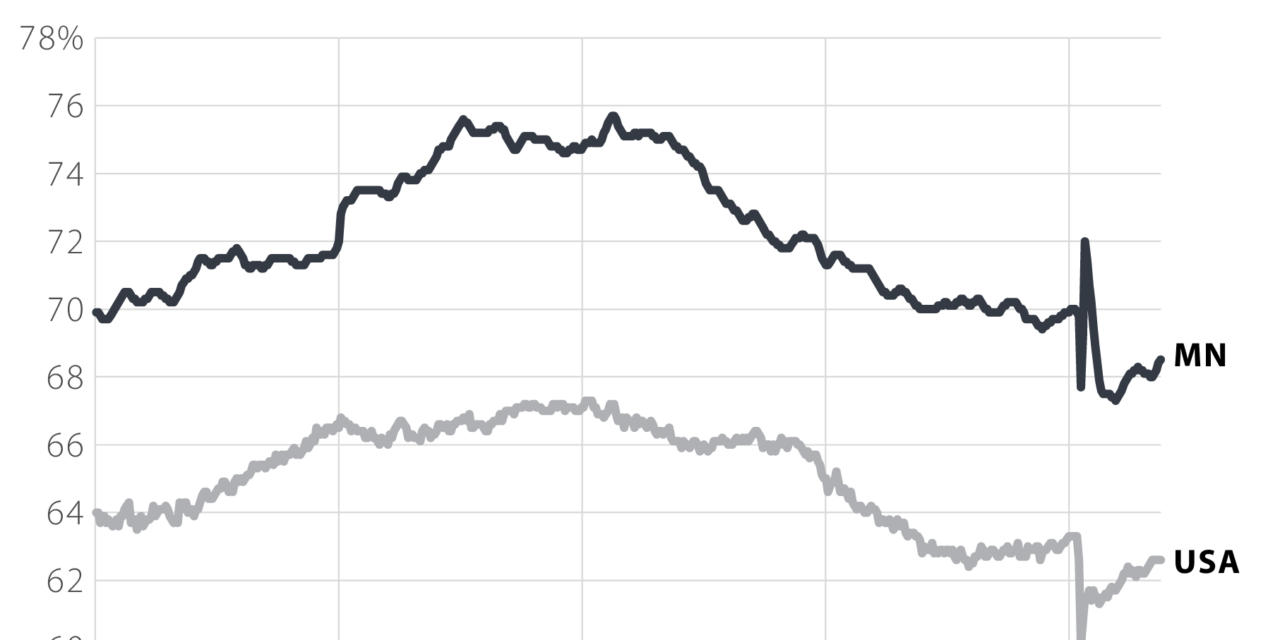
Minnesotans are working
The share of Minnesota residents who are either working or actively looking for work — the so-called labor force participation rate — is consistently higher than the nation as a whole. Few states have as much as 68% of residents over 16 years old working like Minnesota does. Nationally, about 62% of Americans are working or looking for work.
The share of adults working rose steadily through the 1970s, ’80s and ’90s, as more and more women entered the workforce with the women’s liberation movement, greater earning opportunities, and waning gender discrimination. Cuts to welfare in the 1990s also pushed some more people into the labor force, though their living standards didn’t improve much because of low wages at the bottom of the income ladder.
Women in Minnesota work at some of the highest rates in the country, though the price of child care and persistent gender pay gap means women are more likely than men to stay at home to care for children or other family members.
The turn of the millennium ushered in a steady decline in the labor force participation rate as the population aged and Baby Boomers began retiring. The share of adults working in Minnesota peaked in 2001 — with 75% labor force participation — before starting a decades-long decline. This trend was accelerated during the COVID-19 pandemic, as older workers retired and chose not to come back after lockdowns lifted, vaccines became widely available and cases subsided.
Some Republicans continue to blame generous government assistance — like the expanded unemployment insurance that ended in 2021 — for the labor shortage that has everyone from restaurant owners to hospital administrators struggling to find workers.
But zooming in on Americans in their prime working years shows people 25 to 54 years old are out working or looking for work at some of the highest rates on record. There just aren’t enough of them to make up for older people retiring.
The increased competition is good for workers, with low-wage workers notching some of the largest wage gains in decades. It’s also been good for people with less formal education and with criminal records, which employers are increasingly disregarding to fill vacant positions.
Yet the continual aging of the population foreshadows difficulties in the labor market ahead. Employers will have to raise wages, but they will also need to lean into automation and hope the state can attract more out-of-state migrants or immigrants, though the latter will depend a lot on federal immigration laws.
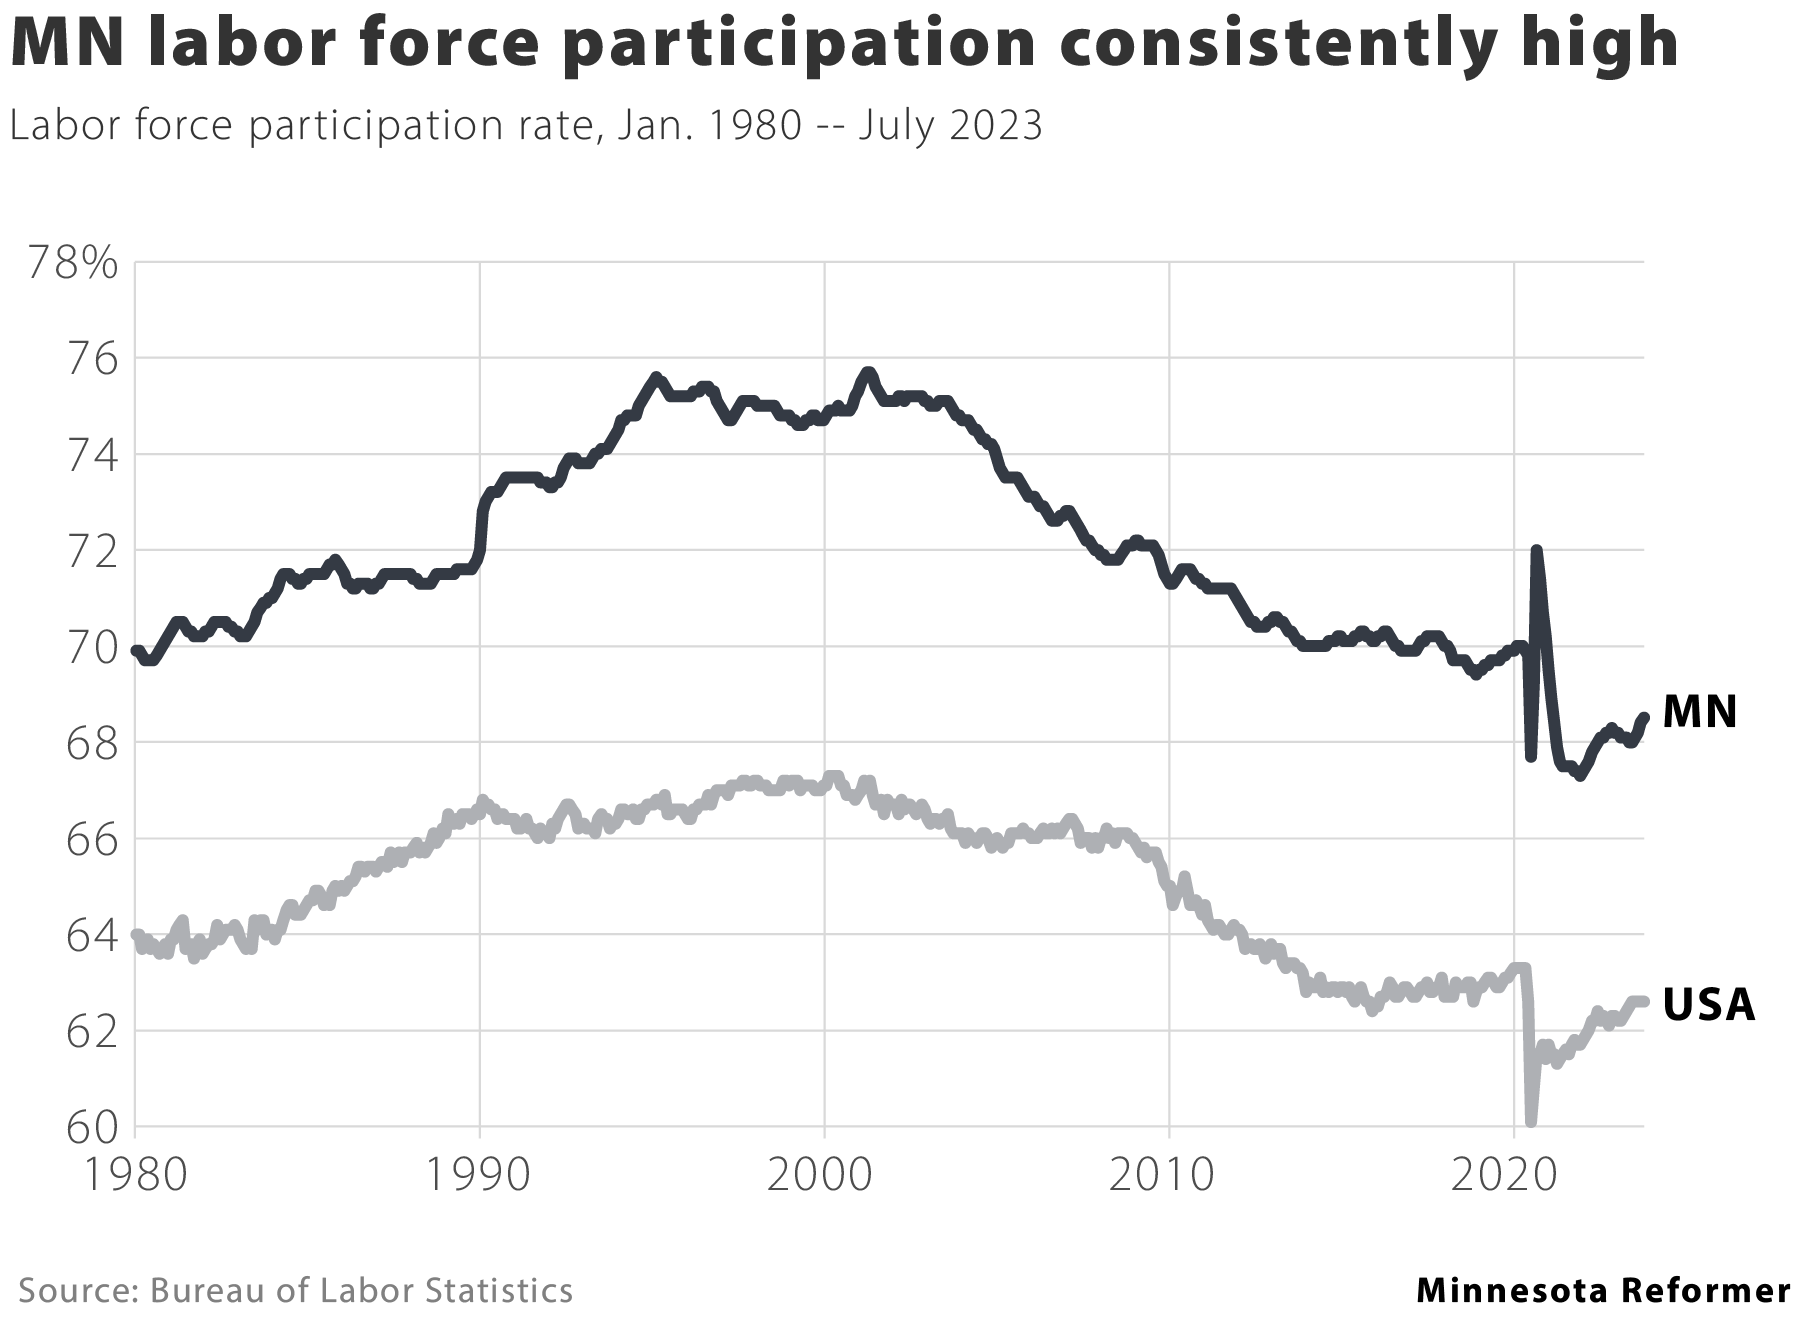
Minnesotans make more on average
The median household income stood at over $80,000 a year in 2021, the most recent year for which Census data is available. That’s considerably higher than the national median of a little more than $70,000, although in inflation-adjusted terms household incomes in both Minnesota and nationally have fallen since 2019. Pandemic-induced price disruptions are largely to blame.
In recent years, hourly pay has been increasing faster for low-wage workers than for higher-wage ones, which has shrunk some of the gap between the top and bottom of the Minnesota income spectrum. Higher minimum wages and a tight labor market for service industry jobs are driving much of that phenomenon.
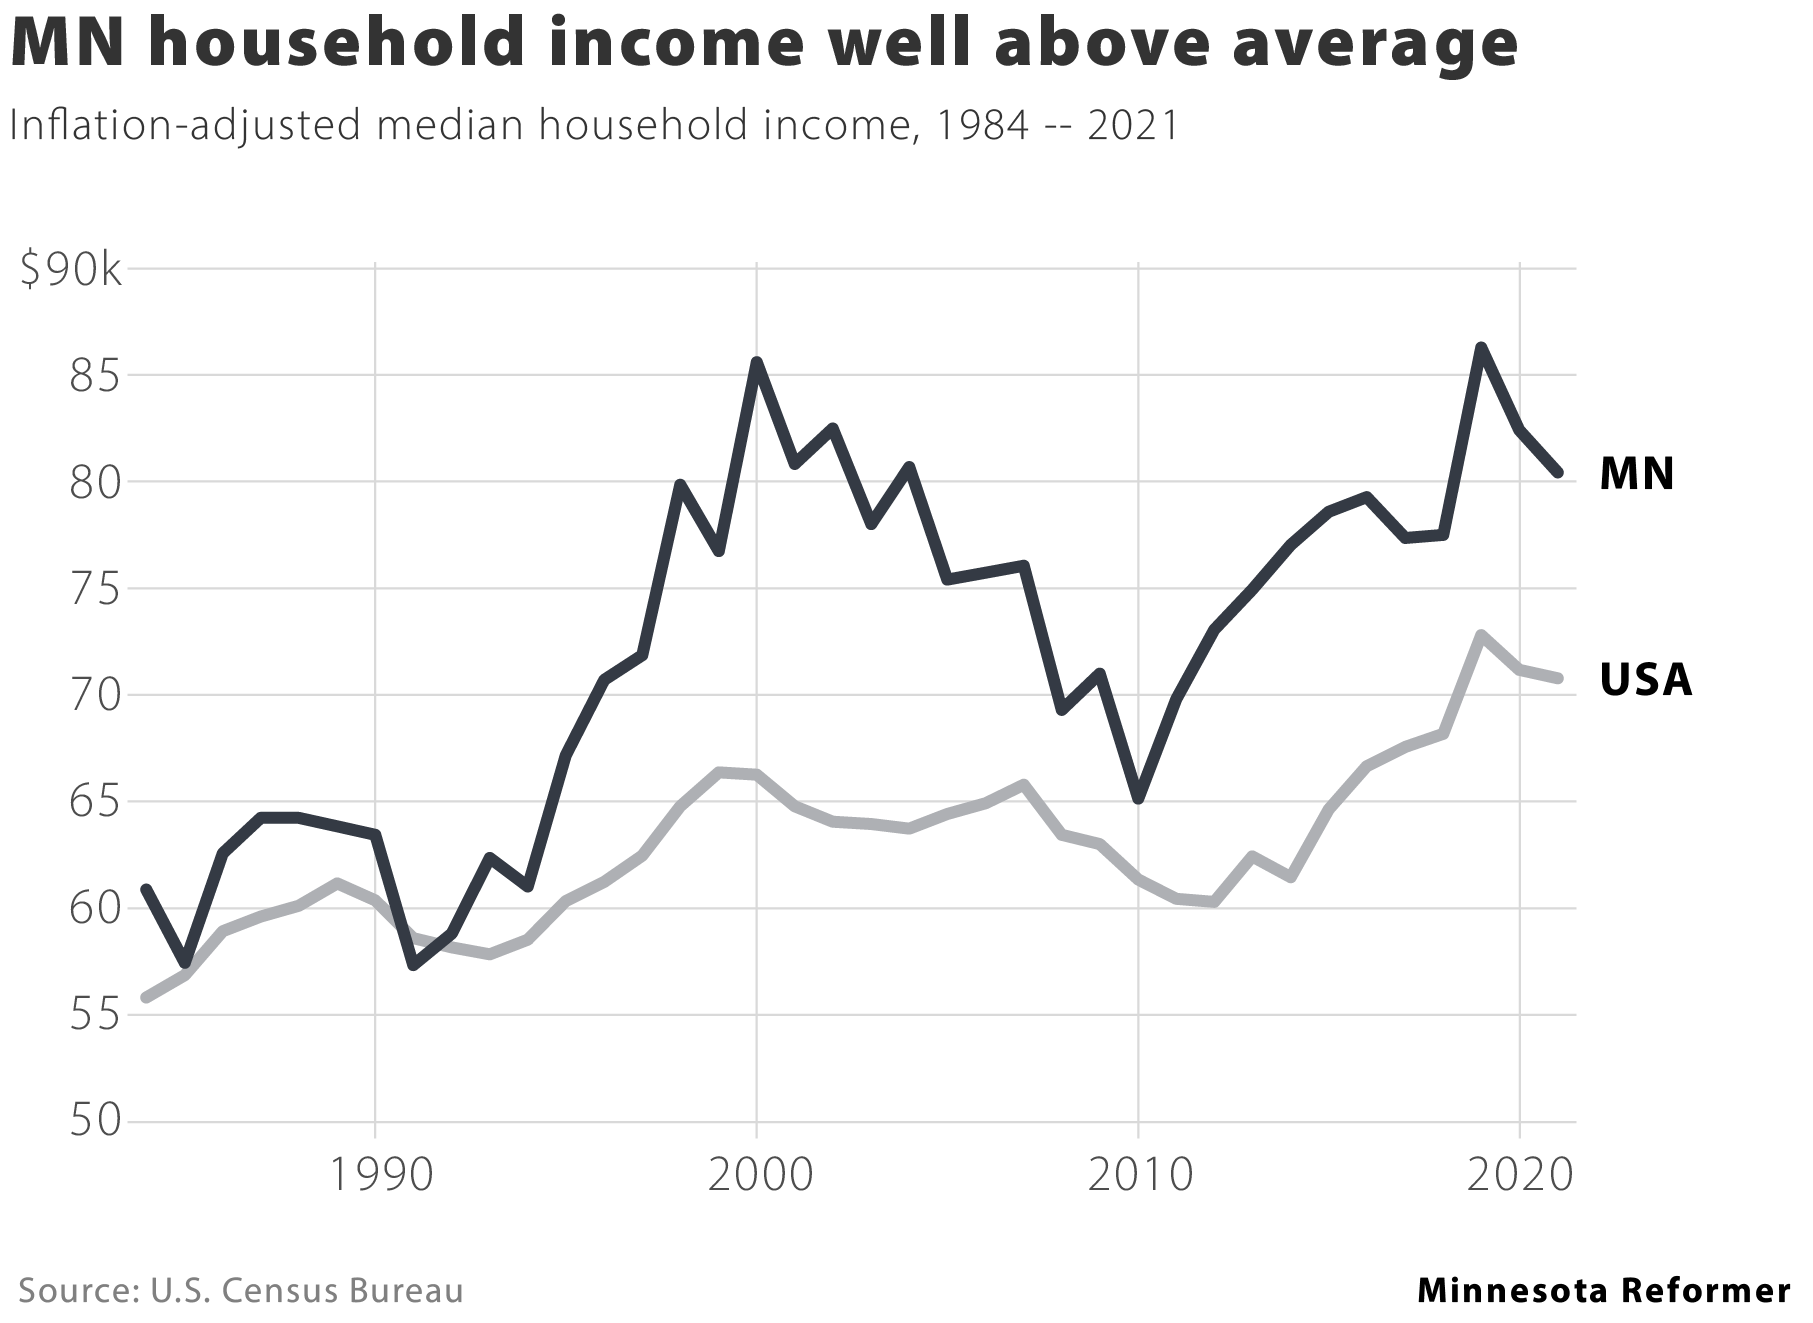
Housing costs are growing
Over the past decade, home price increases have rapidly outpaced wage gains. Ten years ago the typical Twin Cities home sold for as much as the typical household made in about 2.4 years, according to data from the Harvard Joint Center for Housing Studies. In 2022 that same home sold for more than four times the median household income.
The disconnect between income and housing prices in the Twin Cities is worse now than at the height of the housing bubble that preceded the Great Recession – and that’s before you factor in the effect of steeper mortgage interest rates, which push monthly payments even higher.
Home wealth has traditionally been one of the drivers of middle-class prosperity, so soaring costs translate into more financial precarity for families who are unable to purchase a home that would have been more affordable 10 or 20 years ago.
Financial burdens on renters are a separate concern, with the Harvard researchers estimating that 46% of Minnesota renter households are moderately or severely burdened by the monthly cost of rent.
Neither problem is unique to Minnesota, as national average numbers for these indicators are even worse. “Millions of households are now priced out of homeownership, grappling with housing cost burdens, or lacking shelter altogether, including a disproportionate share of people of color, increasing the need for policies to address the national housing shortfall at the root of the affordability crisis,” the Harvard authors write.
Union membership steady over long term

Like labor force participation and wages, union membership is consistently higher in Minnesota than the country as a whole. About one in seven Minnesota workers is a member of a union compared to one in 10 Americans.
Although union workers are a minority of the population, union density is an important metric because unions have outsized influence on industries. Unions, by and large, not only raise wages for their own members but also workers in the same industries.
Unions have benefited from a surge in popular support and organizing efforts from workers across the economy who want higher wages and a greater voice at work: baristas at Starbucks, doctors at Allina, curators at the Minnesota Historical Society, and desk attendants in condo buildings.
The record-high number of union elections has not translated into a significant increase in the share of unionization overall, however. That’s a reflection of how difficult it is to form a union in America. Unionizing is usually a yearslong process and often only covers a single workplace such as one Starbucks location with a dozen workers or a hundred or so doctors at one hospital.
At the same time, larger changes in the economy from traditionally union-heavy manufacturing to largely non-union service jobs have cut into union density nationally. Some workers also choose to decertify their union, like the nurses and support staff at the Mayo Clinic’s Mankato hospital.
CEOs make a lot more than their workers
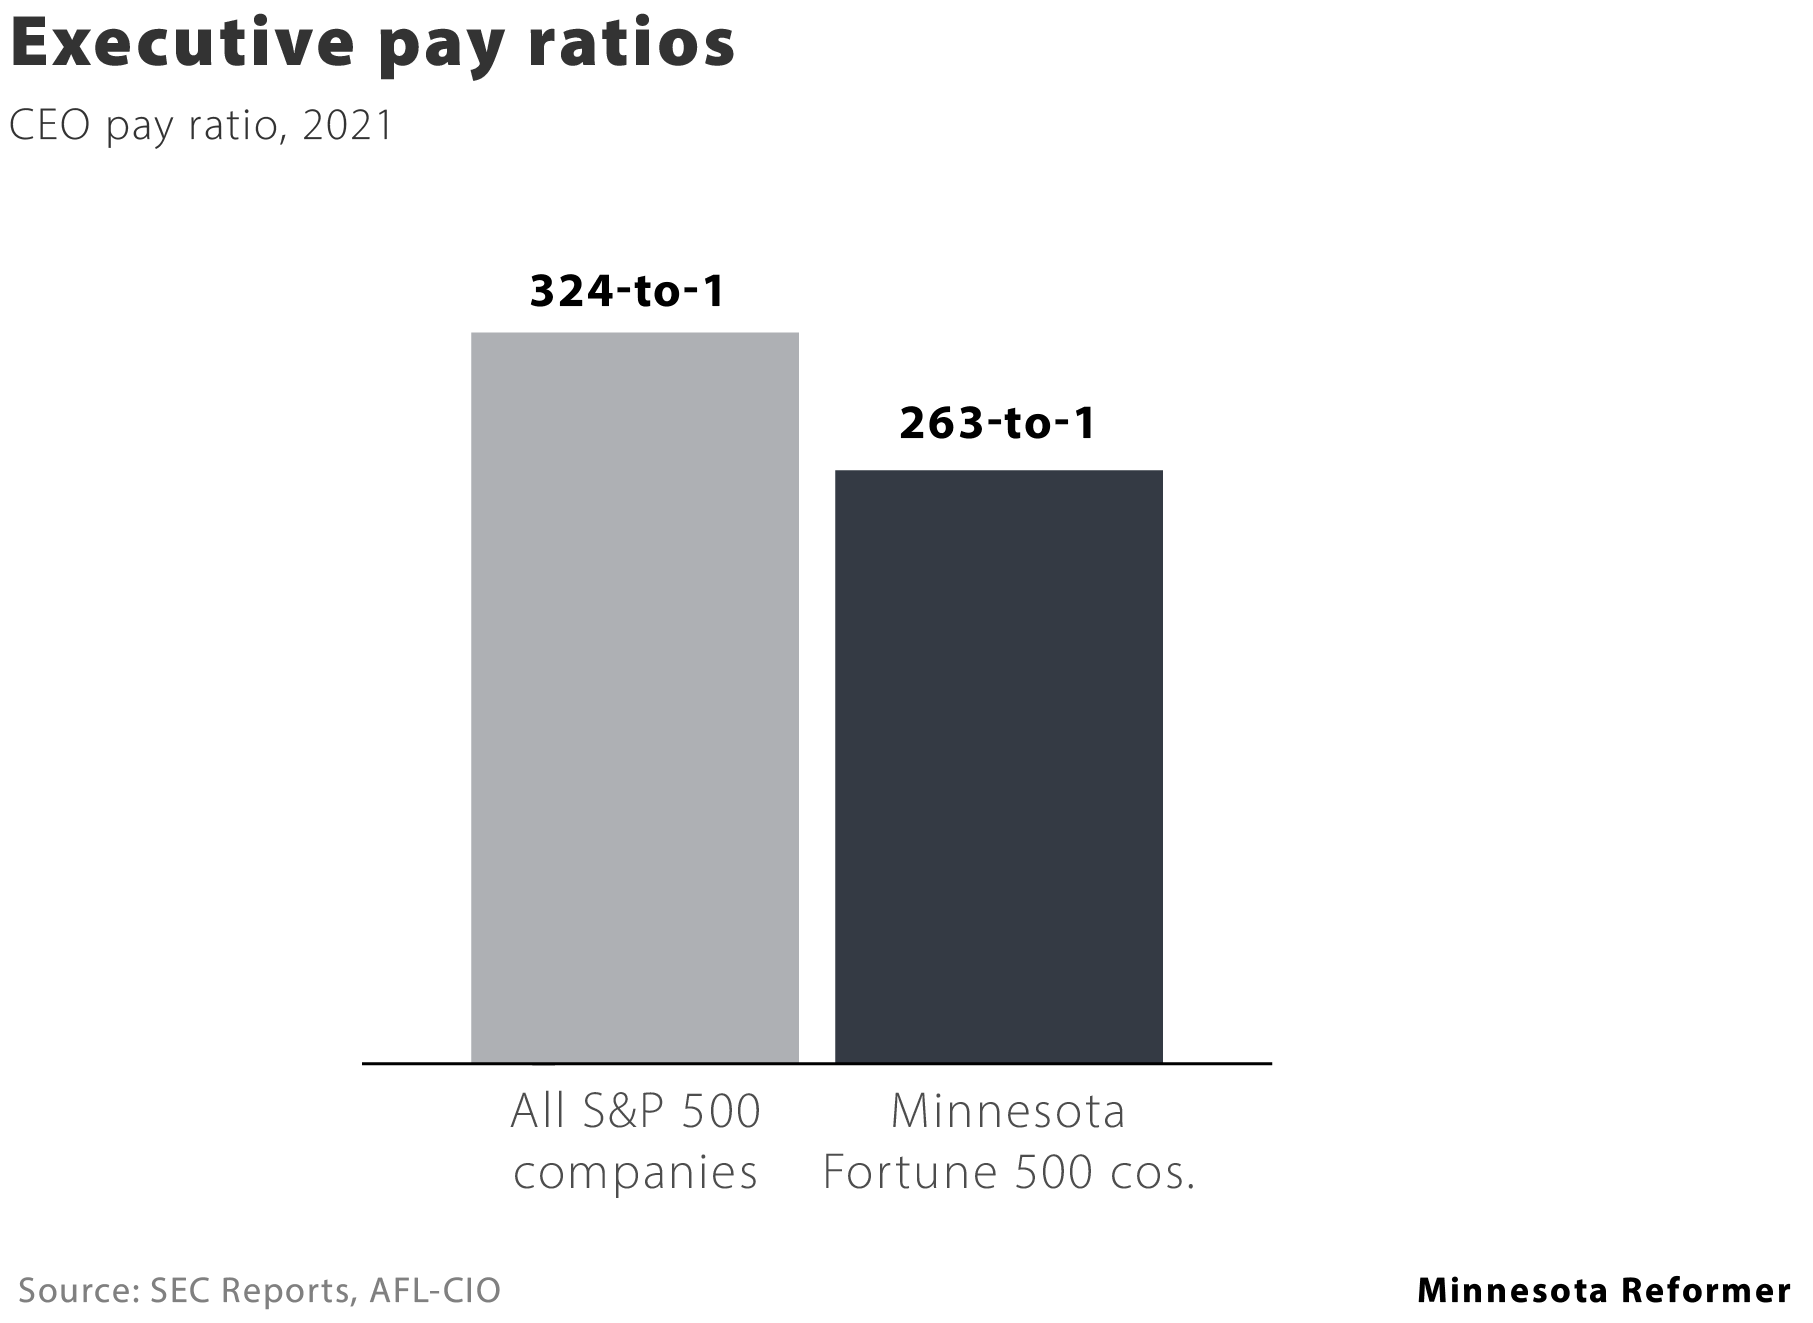
While rank-and-file workers have seen some real gains in the past couple of years, so have executives. CEO pay has soared 1,322% over the past five decades, increasing faster than inflation, faster than the average worker and faster than the stock market.
On average, the CEO of an American company listed on the S&P 500 is paid 324 times that company’s typical worker. The S&P 500 is a broad stock market index tracking 500 of the largest publicly traded companies in the United State (but not the largest 500).
That ratio is slightly smaller in Minnesota, where the average CEO at a Fortune 500 company is paid 263 times that of the typical worker. While these two numbers are not strictly apples-to-apples, they do signal that inequality is less severe in Minnesota. Using a common measure of income inequality called the Gini Index, Minnesota has among the lowest income inequality in the nation.


