
This is a cross-sectional study that used the public domain database of the 2019 National Health Survey (PNS 2019), from the Brazilian Institute of Geography and Statistics (IBGE) in partnership with the Ministry of Health of Brazil. The PNS is a household survey, surveying all 27 Brazilian federative units, with the objective of expanding knowledge about the living conditions and health characteristics of the Brazilian population in order to inform public healthcare policy [9]. Currently, the PNS is conducted every five years. The 2019 PNS survey was approved by the National Research Ethics Committee of the National Health Council (Registration No. 3,529,376). All participants signed an informed consent and/or their legal guardians [14].
Participants and sampling plan
Residents living in permanent private households in Brazil were the eligible participants of the PNS 2019. The Brazilian territory was divided into geographic Census Sectors used by the IBGE for the survey. A Census Sector is the spatial unit of information collection, established by the number of households in an area to be covered by the person who performs the data collection [9].
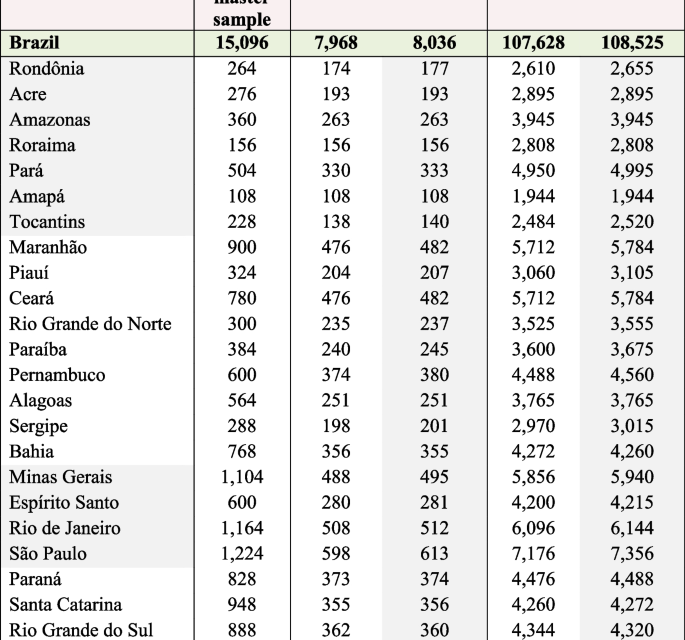
The PNS 2019 sample size calculation followed some specific criteria. Several indicators of interest were considered in determining the sample size of households and people. The sampling plan used was conglomerate sampling in three stages, with stratification of the primary sampling units (UPAs). In the first stage, the Census Sectors or set of sectors formed the primary sampling units; the households were the second stage units; and residents aged 15 years and over defined the third stage units [9]. More details on the sample size planned and selected for the 2019 PNS can be found in the Figs. 1 and 2.

Planned and selected sizes of the sample, according to Federation Units—2019. Source: IBGE, Diretoria de Pesquisas, Coordenação de Trabalho e Rendimento (Research Directorate, Labor Coordination and Income) (IBGE, 2020). Note: PSU = Primary sampling unit. IBGE. Manual Básico da Entrevista. Pesquisa Nacional de Saúde Contínua (Basic interview manual. National Research on Continuous Health.). [Internet]. 2021. Disponível em: https://biblioteca.ibge.gov.br/visualizacao/instrumentos_de_coleta/doc5591.pdf

Flowchart of the 2019 PNS sample calculation and the final sample for the present study related to depression and associated factors among Brazilian adults
To define the sample size of the present study, the sample of households with people, of both sexes, aged 18 years or older (selected resident) was considered [9].
Data collection
The dependent variable considered was depression and the independent variables were those related to socioeconomic and demographic conditions, lifestyle behavior and health history.
The extraction of information of interest for the study was performed by the researchers after defining the dependent and independent variables. The selected variables came from modules C, D, I, J, N, P, Q, U, X/H and W of the 2019 PNS questionnaires. Training for data collection, including questions asked of participants through personal computer-assisted interviews, as well as measurements obtained from individuals, such as weight and height [15], are described in detail in the Health Interview Manual [16], and Stopa et al. [17].
Dependent variable—Depression
A diagnosis of depression, the dependent variable, was made from the Patient Health Questionnaire PHQ-9, an instrument previously validated in Brazil [18], that investigated the occurrence of depressive symptoms over a two-week period prior to data collection of the epidemiological survey [17]. According to the PHQ-9 score of up to 27 points [19], depression was classified into different levels: 1 to 4 – no depression; 5 to 9 – light; 10 to 14 – moderate; 15 to 19—moderately severe; and 20 to 27—severe. According to the methodological rigor employed in the 2019 PNS, individuals who obtained a PHQ-9 score ≥ 10 points were considered as having a diagnosis of depression. Those with lower values were without depression, avoiding the “gray zone” of classification [20, 21].
Investigated independent variables
The independent variables were identified in the PNS-2019 database, recoded, and defined as new variables for the present study and are presented in Tables 1, 2 and 3. They were subsequently distributed into distal, intermediate and proximal hierarchical levels, based on a theoretical-conceptual model of social determinants of health relating factors associated with depression [22, 23].
The distal hierarchical level was composed of socioeconomic variables: macroeconomic region (north; northeast; midwest; south; southeast), level of education (≤ 11 years of study; ≥ 12 years of study), household density (< 4 people per household; ≥ 4 people per household), place of residence (rural; urban), marital status (with partner; without partner), nature of union (civil marriage; stable union).
The intermediate hierarchical level comprised those related to health condition and history, and lifestyle behavior.
Health condition and history variables were diagnosis of a chronic disease, physical or mental, or long-term illness (no; yes), limitation of usual activities due to some illness (no; yes), have a medical health plan (yes; no), have a dental plan (yes; no), time of last visit to the doctor (in years), time of last visit to the dentist (in years), hospital admission for 24 h or more in the last 12 months (no; yes), main reason for seeking care related to their own health in the last two weeks, main health care received when hospitalized (last time) in the last twelve months, general health definition (very good, good; regular; poor, very poor), considering health as a state of physical and mental well-being, and not just the absence of disease, how do you assess your state of health? (very good, good; regular; poor, very poor), Body Mass Index – BMI (≥ 18.5 kg/m2 to < 25 kg/m2—normal; < 18.5 kg/m2—low weight; ≥ 25 kg/m2 to < 29.9 kg/m2—overweight; ≥ 30 kg/m2—obesity), diagnosis of arterial hypertension (no; yes), use of medication to control high blood pressure (yes, all; yes, some; no, none), diabetes diagnosis (no; yes), use of medication to control diabetes (yes, all; yes, some; no, none), high cholesterol diagnosis (no; yes), diagnosis of cardiovascular disease (no; yes), diagnosis of arthritis or rheumatism (no; yes), diagnosis of work-related musculoskeletal disorders (no; yes), diagnosis of chronic lung disease (no; yes), diagnosis of cancer (no; yes), diagnosis of chronic kidney failure (no; yes).
Lifestyle behavior variables were practice of physical exercise or sport in the last three months (yes; no), number of hours of physical activity per week (≥ 3 h per week; < 3 h per week), current habit of smoking a tobacco product (no; yes, daily; less than daily) history of smoking habit—smoking a tobacco product daily (no; yes, daily; less than daily), self-reported assessment of oral health—teeth and gums (Very good, good; Regular, poor, very poor), eating disorder—difficulty eating because of problems with teeth or dentures (none; mild, regular, intense, very intense), number of missing upper permanent teeth (≤ 6 teeth; > 6 teeth), number of missing lower permanent teeth (≤ 6 teeth; > 6 teeth), and use of dental prosthesis (no; yes).
Finally, the proximal hierarchical level was composed of demographic variables: age (18—44 years, 45—64 years, ≥ 65 years), sex (male, female), race/skin color (black, brown, white, yellow and indigenous).
Statistical analysis
Data analysis was performed using the statistical package STATA® version 16 (StataCorp LLC, College Station, TX, USA).
Descriptive analyzes based on the presence or absence of a diagnosis of depression were performed using simple and relative frequencies for categorical variables. The prevalence of depression was calculated. To identify factors associated with depression, groups with and without a diagnosis of depression were compared using bivariate analysis. Therefore, Pearson’s chi-square test was used for categorical variables, with a significance level of 0.05. Logistic regression analysis was used, obtaining the unadjusted odds ratio and the respective 95% confidence interval (95% CI).
The hierarchical analysis of factors associated with depression was performed after the identification and selection of independent variables according to their epidemiological importance and construction of a theoretical-conceptual model on the topic [19, 20], as well as a significance level ≤ 20% obtained by bivariate analysis, using a forward strategy. Finally, at the proximal hierarchical level, variables with p value ≤ 0.05 were selected for the final model. The evaluation of collinearity between the independent variables was performed to better select possible factors associated, using Pearson’s correlation coefficient, with the variance matrix.
The selection of independent socioeconomic variables to be included in the first level, distal hierarchical level, is related to their epidemiological importance after the construction of a theoretical model on the subject since all of them presented statistical significance. This initial decision was also taken for the inclusion of the independent variables in the other two hierarchical levels. Therefore, the variables of the distal block, macroeconomic region, education level and marital status remained associated with depression (p < 0.01) and were selected as adjustment variables in the next hierarchical level, the intermediate hierarchical level. In this block, together with those of the previous level, the variables related to health condition and history, and lifestyle behavior were tested: self-reported health conditions, Body Mass Index (BMI), diabetes, cardiovascular disease, Work-Related Musculoskeletal Disorder (WRMD), chronic lung disease, cancer and kidney failure, physical activity, history of smoking habit, and eating disorders. The selection of variables for the last hierarchical level was performed not only by the statistical criterion of p ≤ 0.20, but also by its epidemiological importance to depression. Thereby, in the last block, proximal hierarchical level, demographic variables were tested, along with those initially selected for the distal level and self-reported health condition, BMI, cardiovascular disease, WRMD, chronic lung disease, and history of smoking habit. In the proximal hierarchical level, demographic variables with p value ≤ 0.05 were selected for the final model.
From a theoretical-conceptual model of multicausality between independent variables and depression, as well as from the analysis of hierarchical levels, the selection of adjustment variables was performed for the multiple regression analysis. Finally, to identify factors associated with depression, logistic regression analysis was used, obtaining the crude and adjusted Odds Ratio (OR) and the respective 95% confidence interval (95% CI).
Specific procedures were used in data analysis, using weighting to correct the sample design with the definition of weights, strata and unit samples, according to the complex analysis module. The “survey” (svy) was used to perform the analysis, with consideration of the sampling design effect, non-response rates, and post-stratification weights. The analytical techniques used for weighting were the estimation of Taylor’s linearized variance and the centered method to define the single sampling unit.


